How to Build an Honest ROI Model for Auto Insertion (Without Vendor Optimism)
How to Build an Honest ROI Model for Auto Insertion (Without Vendor Optimism)
The most expensive auto insertion machine is not the one with the highest CPH rating. It is the one that was justified with a flawed ROI model — then sat underutilized because the payback never materialized as promised.
I have seen this pattern repeat across factories. A plant manager receives a one-page ROI projection from an equipment vendor showing a 10-month payback. The machine is approved. Sixteen months later, the savings are still being tracked, and the second machine was never ordered. The technology gets blamed. In reality, the model was the problem.
This article provides a framework for building an honest ROI model for THT auto insertion — one that accounts for the variables most vendor projections conveniently omit. The goal is not to discourage automation. It is to ensure that when you invest, the numbers hold up on the factory floor.
The Hidden Cost of Manual Insertion That Nobody Benchmarks
Before calculating what you will save with auto insertion, you need a clear baseline of what manual insertion actually costs. Most factories track direct labor as labor hours multiplied by hourly wage. This captures perhaps 60% of the real cost.
The missing 40% includes:
Training churn. In markets where labor turnover exceeds 30% per year, a significant fraction of your insertion labor is performed by operators with less than three months of experience. Their insertion speed is lower — typically 300 to 500 CPH rather than the 600 to 800 CPH of a seasoned operator — and their error rate is higher. This training penalty never appears on a P&L line, but it directly affects throughput and yield.
Defect-induced rework. Manual insertion typically carries a 2–5% rework rate. Each reworked board requires identification, desoldering, re-insertion, re-soldering, and re-inspection. Industry benchmarks suggest the fully loaded cost of a single rework cycle is 3–5x the cost of the original insertion. In a high-volume line running 5,000 boards per shift, even a 2% rework rate translates to significant hidden cost.
Positional flexibility overhead. Manual insertion lines require operators to be present at each station. When one operator is absent, the line slows or stops. The cost of this inflexibility — idle time, expedited hiring, overtime premiums — is substantial but rarely attributed to the insertion process itself.
When you add these factors, the true per-board cost of manual insertion is often 30% to 50% higher than the simple wage-based estimate. That gap is where auto insertion's ROI logic lives.
How Auto Insertion Changes the Cost Structure
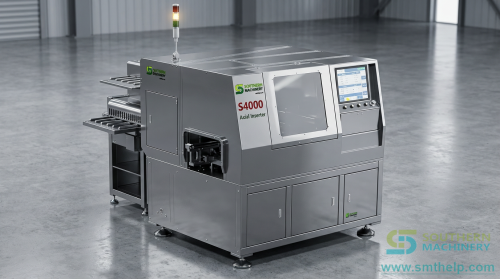
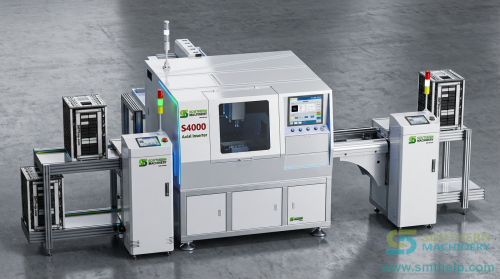
Auto insertion machines fundamentally change this cost model. A single S-3010B radial inserter, for example, can achieve an actual throughput of 13,000 CPH in production conditions. An S4000 axial inserter reaches 20,000 CPH under similar conditions. Compare this to 300–800 CPH per operator, and the productivity multiple is clear: one machine replaces the throughput of roughly 7 to 10 manual operators on the component types it handles.
Several specific mechanisms drive this efficiency:
Consistent cycle time. Unlike human operators whose speed fluctuates with fatigue, shift timing, and experience level, an auto insertion machine delivers the same cycle time on the 10th board as on the 1,000th. This predictability is valuable for line balancing and production scheduling.
Precision clinch control. Clinching at a defined angle and length eliminates the inconsistent lead bend that causes tombstoning and cold joints in downstream Wave Soldering. With adjustable clinch angles and lengths, auto insertion machines reduce post-solder defects to under 0.5% on the inserted components.
Force monitoring and rejection. Real-time insertion force detection catches bent leads, missing holes, and misaligned components before they proceed downstream. A defective insertion is automatically flagged and re-attempted, preventing the 3–5x multiplier of post-solder rework.
Reduced training dependency. One operator can manage three to four auto insertion machines. The knowledge required to operate the equipment is contained in the machine's software and vision system — not in a single operator's muscle memory. This dramatically reduces the risk posed by labor turnover.
Building the Honest Model: Four Variables That Matter
Most vendor ROI projections assume a utilization rate of 85% or higher, zero changeover overhead, and a 1:1 substitution ratio. None of these hold in practice. Here is a more realistic framework.
Variable 1: Utilization rate, not theoretical CPH.
Theoretical CPH is measured under ideal conditions — continuous feeding, no changeovers, no interruptions, no jam clearance. In actual production, utilization typically runs between 60% and 75% for single-machine setups, rising to 75–85% for lines with multiple machines and balanced workflow. Use 65% for a conservative first-year estimate. If your line already runs balanced SMT/THT production, you can adjust upward in year two.
The S-3010B illustrates this point well: its theoretical speed is 22,000 CPH, but its stated actual throughput is 13,000 CPH — roughly 59% utilization. This is not a flaw in the machine; it is an honest representation of what production conditions deliver. A vendor that communicates actual rather than theoretical CPH is already giving you a more useful baseline.
Variable 2: Changeover overhead.
Every component changeover takes time — clearing the feeder lane, loading the new reel, adjusting the span settings, and running first-article inspection. In a high-mix environment producing 20 or more board variants per week, changeover can consume 10% to 15% of available production time. This time should be explicitly modeled, not buried in a utilization percentage.
Variable 3: Labor substitution ratio.
One machine does not eliminate 7–10 operators on day one in most factories. Operators are reallocated to other stations — post-solder inspection, hand-loading odd-form components, board depaneling. The real labor savings typically materialize over 6 to 12 months as natural attrition reduces headcount. Model a phased ramp: 40% labor reduction in months 1–3, 70% in months 4–8, full substitution by month 12.
Variable 4: Component mix applicability.
Auto insertion handles standard radial, axial, and DIP components efficiently. But odd-form components — transformers, connectors, relays, terminal blocks — still require manual or dedicated odd-form insertion. An honest model accounts for the percentage of your total THT component count that falls outside the machine's capability.
When Automation Makes Sense — and When It Does Not
Auto insertion delivers the strongest ROI in these scenarios:
- Two-shift or continuous operations. Fixed costs (equipment depreciation, floor space) are spread across more hours.
- High-volume, low-mix production. Fewer changeovers, higher utilization.
- Labor-constrained markets. Wage inflation and labor shortages make the substitution economics more favorable.
- Standard THT-dominated boards. Boards where 60%+ of through-hole components are radial, axial, or DIP.
It may not pencil out in:
- Very low volume (under 50,000 insertions per annum).
- Extreme component mix where changeovers exceed 20% of available time.
- Fully depreciated manual lines where the incremental cost of additional operators is genuinely marginal.
For factories in the middle range — moderate volume, moderate mix — the partial retrofit strategy is worth evaluating. Adding a single auto insertion machine to handle the highest-volume component types while keeping manual stations for the balance can yield 50–70% of the full automation benefit at 30–40% of the investment. Southern Machinery's product range, spanning from radial inserters like the S-3010B to axial machines like the S4000, is designed with this incremental upgrade path in mind.
The 5-Minute Audit
Here is a practical exercise you can run this week:
1. Track the actual manual insertion time for your three highest-volume PCBA models across one full shift. Count total components inserted and total direct labor hours.
With five numbers — actual CPH, standard-component percentage, weekly variant count, annual insertion volume, and your fully loaded labor cost per hour — you can build a first-pass ROI model that is more honest than any vendor's one-pager. Adjust the four variables above to your specific line conditions, and the result will tell you whether auto insertion pencils out in your factory — not in a sales brochure.
Free Resource: Auto Insertion ROI Calculator Template
Use this template to calculate the payback period of auto insertion for your specific production scenario. Enter your CPH, labor costs, component mix, and shift schedule to get a realistic payback projection.
Download ROI Calculator Template (PDF)